Blog Archive

Showing posts with label environment. Show all posts

Monday, June 11, 2012

A Google Map for the New Economy


The Global Transition to a New Economy is a Google Map designed to showcase projects around the world that are part of a new developing economy.

The 'new economy' is one that "maximizes well-being, operates within environmental limits and is capable of coping and adapting to global environmental change".  The map is crowd-sourced and invites contributions from organisations and projects that want to help build a framework to define this new economy.

The contributed projects are color-coded by category. The categories include 'citizens and communities, finance, currencies and local economies. 

Monday, June 4, 2012

Detecting Deforestation with Google Maps


The Global Forest Disturbance Alert System provides data on forest disturbance globally on a quarterly basis.

Using Google Maps the system pinpoints areas that are being deforested on a quarterly basis. The system compares MODIS global vegetation index images at the exact same time period each year in consecutive years. It registers change when more than 40 percent of a forest area has lost greenness over the previous 12 months.

The red markers on the map show the centre point of the detected areas. The cause(s) of any forest disturbance points detected have not been confirmed by other means so consequently the system provides little information above the actual locations of possible deforestation.

Monday, May 28, 2012

Amsterdam Soil Quality on Google Maps


The Amsterdam City Council Planning Department has used the Google Maps API to provide a map of the city's soil quality.

Bodemkwaliteit Amsterdam displays a number of different zones in Amsterdam, demarcated by soil quality. The map can therefore be used to determine the potential re-use of excavated soil, from the location of its excavation. The different zones on the map are color-coded by type of soil. The green and blue zones on the map indicate cleaner soil and the red zones indicate heavily contaminated soil.

Thursday, May 24, 2012

BioFuel Resources on Google Maps


The National Renewable Energy Laboratory (NREL) has created a BioFuels Atlas using the Google Maps API. The map shows the locations of biomass resources in the U.S..

Using the map it is possible to view overlays of bioenergy and brownfield sites, distribution infrastructure, and power plants. The 'State View' option allows the user to zoom in on a selected state and view a summary of traditional and bioenergy infrastructure in the state beneath the map.

The map also includes an analysis tool that allows the user to select a point on the map and convert the biomass resources within a specified area into potential biofuel production.

Wednesday, May 23, 2012

The Sumatran Rainforest on Google Maps


The island of Sumatra in Indonesia has lost almost 50% of its tropical rainforest in the last 35 years. The World Wildlife Fund, Eyes on the Forest and Google Earth Outreach have joined forces to create a Google Map of land cover, land use, and land users in Sumatra.

Eyes on the Forest: Sumatra allows users to explore data about the island's conservation values, forest diversity and wildlife. The aim of the map is to increase transparency about the threats to the Sumatran environment and identify the drivers of deforestation and habitat destruction.

It is possible to view a number of data layers on the map, including the dwindling rainforest cover over the last 35 years, wildlife ranges, protected areas and natural carbon stores.

Friday, May 18, 2012

Toxic Waters on Google Maps


The New York Times Water Pollution Map is a Google Map of over 200,000 facilities in the U.S. which have permits to discharge pollutants.

Users can search the map by state. Each state map shows at a glance all the polluting facilities. The blue markers on the map indicate facilities that have not violated their permits and the orange markers show the facilities that have one or more violations.

If you click on a map marker details about the selected facility are displayed beneath the map, including information about violations, fines charged and enforcement actions.

Wednesday, May 9, 2012

Nature Conservancy with Google Maps


TNC Maps is a collection of Google Maps from Nature Conservancy scientists, in collaboration with governments, scientists and conservation organizations around the world. The site includes over 80 global maps describing the state of terrestrial, freshwater and marine habitats worldwide.

The maps provide a great insight into nature conservancy around the world. Users can select a map from the drop-down menu and the Google Map is automatically updated to show a heat-map of the selected data. The available data includes information on many conservancy issues, such as forest clearing, threatened species and habitat loss.

All the data from the maps is held in Fusion Tables and can be downloaded via the link beneath the map.

Tuesday, May 1, 2012

Resource Intensity of Cities on Google Maps


Resource Intensity of Cities analyses data on material and energy use in 42 U.S. cities.

The application uses a Google Maps interface to allow users to select an area and visualise a heat map of population, material and energy. It is also possible to generate a downloadable PDF report for the selected area.

The PDF includes a Google Map of the searched area and a detailed breakdown of population and housing density, material intensity, material comparison, energy intensity and energy comparison.

Monday, April 23, 2012

Germans Living Near Nuclear Plants


Last year I reviewed Zeit-Online's American Nuclear Power Plants Map. A Google Map that shows how many Americans live near nuclear power plants. Zeit-Online has also created a similar map for its German readers.

The German Nuclear Power Plants Map shows how many people live close to German nuclear power plants. The map includes a distance slider tool that lets you visualise how many people live within different distances of a nuclear power plant.

After radioactive material escaped from Japan's Fukushima power plant, everyone within 30 kilometres of the plant was evacuated. The Zeir-Online map shows that nearly 10 million Germans live within 30km of a nuclear power plant.

Wednesday, April 18, 2012

U.S. Renewable Energy on Google Maps


The National Renewable Energy Laboratory has created a series of Google Maps related to renewable energy in the U.S..

The maps help to visualise a number of renewable energy data sets that show the potential for renewable energy in the U.S.. The maps include solar power and wind power guides, alternative fueling stations, geothermal resources and many more.

Hat-tip: Visualising Urban Futures and Street View Funny

Wednesday, April 11, 2012

The Map of Life


The Map of Life is an impressive attempt to map life on Earth.

Using the application it is possible to click on a Google Map and get a list of all the different types of bird, fish, reptile, amphibian or mammal that live in a set radius around that location. For example, if I click on my address the map returns a list of 168 different types of bird and 32 different types of mammal.

It is also possible to use the map to view the worldwide habitats of different species. If you enter the name of an animal species the map will shade in the areas of the world that the animal inhabits.

Thursday, April 5, 2012

Earth Hour on Google Maps


On March 31 people around the world switched off their lights for Earth Hour.

The World Wildlife Fund has created a Google Map called Show Us Your Earth Hour 2012. The map displays photographs and videos from around the world showing what participants did for Earth Hour.

If you click on a map marker you can also click through to read details about how the respondents spent their hour of darkness.

Hat-tip: Street View Funny

Wednesday, April 4, 2012

Harvesting Water with Google Maps


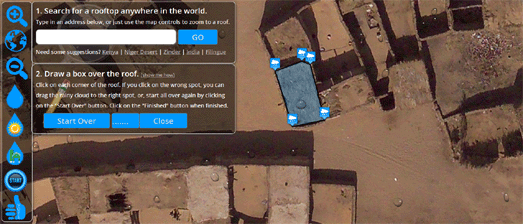
Save the Rain is a great application that helps users determine how much rainfall can be harvested from any roof in the world.

Using Google Maps satellite imagery of your house it is possible to draw a polygon on the map to determine the area of your roof. The application then uses the yearly precipitation data for your area to work out how much rainwater you could harvest in a year.

The results also display a number of different types of crops and tells you how much you could grow of each crop with the water harvested.

In addition to the water harvesting calculation tool Save the Rain provides a number of rain related choropleth map views. One map view displays worldwide annual rainfall. Another map view shows the projected change in annual precipitation by 2100. A third map view displays the percentage of the world's population with access to an adequate amount of water.

Thursday, March 29, 2012

The Real Heat Map of England


The UK Department for Energy and Climate Change has released a real heat map for England. I say 'real' because it actually uses Google Maps to display heat use at building level throughout England.

The CEO - Heatmap shows heat demand from individual buildings throughout England and provides a range of tools to help developers and planners identify priority areas for low carbon heat projects.

The map was created using a bottom-up address level model of heat demand and does not use personal data (for example from individual household meter readings). It estimates the total heat demand of every address in England based on published sub-national energy consumption statistics.

The model seems very accurate. I notice in the streets around my location that the map shows much more energy consumption in blocks of flats than in individual homes.

Tuesday, March 20, 2012

Water Quality on Google Maps


French website Que Qhoisir has created a Google Map showing the The Quality of French Tap Water. The map is based on the results of a water analysis of 36,568 communes by the Ministry of Health.

Users of the map can search the map by address or postcode. The map will then display the tap water quality results recorded near that location. Each result give details about the quality of the water under a number of headings, including pesticides, selenium, bacteria, radioactivity and aluminum.

Thursday, March 8, 2012

Solar Grid Parity on Google Maps


Energy Self-Reliant States has created an animated Google Map to show how "within a decade 100 million Americans could get cheaper electricity from rooftop solar".

Re-mapping Solar Grid Parity shows when major metropolitan areas are likely to be able to beat grid prices by using solar power. The map includes an animated timeline that adds the metropolitan areas to the map when they are likely to reach the tipping point of solar power being cheaper than grid prices.

This map includes the 30% federal tax credit for solar power. If you want to see when areas will reach grid parity without taking into account the federal tax credit you can use the original Mapping Solar Grid Parity Map.

Friday, March 2, 2012

Recycling Google Maps Directions - Chicago


Recycle City Chicago helps citizens of the windy city find the closet recycling drop-off center from their location.

The application was the winner of the Green Opportunities Award in the Apps for Metro Chicago competition and it easy to see why. If users enter their address into the Google Map they can get turn by turn driving directions to their nearest recycling center.

If you click on a recycling center's marker on the map you can view the opening hours and the materials that can be recycled at the center.

Wednesday, February 29, 2012

Recycling Google Maps Driving Directions


Rota da Reciclagem is a Google Maps based application that provides Brazilians with driving directions to their nearest recycling centre.

Users of the application can enter their home address and the map will automatically display a polygon showing the route to the nearest recycling centre. A map marker displays the user's home location. Click on the map marker and a link is provided to view turn-by-turn directions to the recycling centre.

Tuesday, February 28, 2012

The Google Maps API as a GIS


The Kentucky Land Use Map is a very impressive Google Map from The University of Kentucky College of Agriculture. It is another great example of the Google Maps API being used as a fully functioning geographic information system.

The map allows the user to view a number of land use data clouds directly on the map. The layers include soil boundaries and flood zones. It is also possible to click on the map and view the NRCS soil survey data for the chosen location.

Friday, February 24, 2012

Fukushima Real-Time Radiation Map


The Ministry of Education, Culture, Sports, Science and Technology, Japan has released a real-time map of radiation measurements in Fukushima Prefecture. The Japan Radiation Monitoring Map uses Google Maps to show the radiation levels measured by monitors throughout the Fukishima Prefecture.

The measurements displayed on the map are updated every ten minutes. The map uses a marker clustering system to show how many radiation monitor measurements are available at different locations. If you click on a marker all the measurements from that point can be viewed in the map sidebar.

Popular Posts