(Click to view)
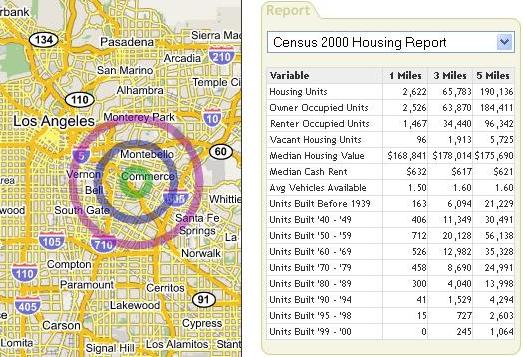
This tool makes use of 2000 U.S. Census data so the information might be a bit out of date, but the tool gives you a rough indication of the current situation in a given area. This Google Maps tool could be used by all levels of government to navigate census data that can be fine-tuned to a specific geo-location instead of trying to sift through tables and confusing text presentation. Another possible use is to center your local business or potential business location to gather information for a business plan or marketing campaign that you might be working on. The uses are endless!
This tool gives us a glimpse into how all location-based information (not just demographic data) could be displayed in Google Maps fashion in the future.. I personally think this mashup is very big and has huge potential for how this and other mashups can display information.


0 comments:
Post a Comment